
Most maintenance leaders want the same things: fewer surprises, safer operations, better uptime, and less wasted spend.
Predictive maintenance promises all four, and nearly every business pitching it to you draws the same picture: a maturity curve with reactive at the bottom, predictive at the top, and an arrow pointing up and to the right.
Almost fifty years of reliability research, from the aviation studies that created reliability-centered maintenance to the US Department of Energy’s maintenance benchmarks, points to a different conclusion.
Mature organizations run a deliberate mix of reactive, preventive, and predictive strategies, chosen per asset and per failure mode. What matures is the quality of the decisions, and the data behind them.
This article lays out the maturity model as we see it, what the research says about each stage, and where the real constraint sits for teams running on SAP.
The five stages of maintenance maturity.
Here is a simplified view of the typical stages. Everyone describes it differently, but the idea is always the same: the basis for decisions moves from experience, to intervals, to analysis, to data.
Stage 1: Firefighting.
Work starts when something breaks. Priorities are set by whoever shouts loudest, and the schedule is whatever the day brings. You know you are here when the backlog lives in someone’s head and your most experienced technician is the de facto planning system.
Firefighting is different from run-to-failure. Letting a cheap, redundant, non-critical asset run until it breaks can be the correct strategy, decided in advance. Firefighting is what happens when nobody decided anything.
It’s a mode that is hard to get out of. Firefighters are heroes: they get lots of pats on the back after every fix and are always in demand.
Stage 2: Planned.
Work orders exist, maintenance is scheduled, and intervals come from manufacturer recommendations or habit. This is a big step up from firefighting, and it is where a CMMS or SAP PM starts to pay off.
Stage 3: Preventive.
Here you are able to prevent known failure modes. Failure codes get analyzed, criticality drives prioritization, and inspections or operator rounds feed decisions.
Stage 4: Predictive.
Condition monitoring and analytics flag failures before they happen, and asset health triggers work instead of the calendar. Here work is done at the right time, so you avoid both over- and under-maintenance and use your resources more efficiently.
Done well, this applies to the assets where prediction pays, while simpler strategies keep covering the rest.
Stage 5: Intelligent.
Yes, this one is buzzword worthy, up there with lights out manufacturing and Industry 6.0. With intelligent maintenance, planning becomes a closed loop. The system weighs asset health, risk, constraints, and outcomes, then proposes the plan for humans to approve.
Few organizations operate here today, but SAP is building toward it: at Sapphire 2026, its flagship demo had AI agents reviewing incident history and proposing pre-filled work orders for maintenance teams to approve. We covered what was announced in our guide to SAP’s Autonomous Enterprise.
What the reliability research says.
Most failures are not age-related.
The maturity conversation starts in aviation. In 1978, F. Stanley Nowlan and Howard F. Heap of United Airlines published Reliability-Centered Maintenance, a study sponsored by the US Department of Defense that analyzed how aircraft components actually fail.
They identified six distinct failure patterns and found that only about 11 percent of the items studied failed in ways related to operating age.
The other 89 percent showed no wearout zone, meaning no age limit or fixed interval could improve their reliability.
The largest single group, 68 percent, showed the opposite of wearout: failure probability was highest right after installation or overhaul, then settled to a constant level.
Nowlan and Heap’s answer to the randomness problem was reliability-centered maintenance: analyze each failure mode, weigh its consequences, and assign the strategy that fits.
You will have a mix of maintenance methods.
John Moubray’s Reliability-Centered Maintenance Second Edition carried the Nowlan and Heap aviation method into general industry in the 1990s. Its decision logic is explicit on a point that maintenance maturity curves tend to skip: for some failure modes, the correct output is no scheduled maintenance at all.
The US Department of Energy’s Operations and Maintenance Best Practices Guide makes the same point with numbers. It recommends leaving inexpensive, non-critical, and redundant equipment on a reactive approach, and it reports the maintenance mix of continually top-performing facilities as under 10 percent reactive, 25 to 35 percent preventive, and 45 to 55 percent predictive.
The cost gap between the stages is measured.
The same Operations and Maintenance Best Practices Guide puts numbers on the transitions.
- A preventive program saves an estimated 12 to 18 percent over a purely reactive one.
- A functioning predictive program saves a further 8 to 12 percent over preventive alone, and facilities leaning heavily on reactive work can find opportunities exceeding 30 to 40 percent.
Treat the exact figures with care, of course. The guide dates to 2010 and some of the underlying surveys to 2000.
How to read the maintenance maturity model.
In light of the research mentioned above and cold, hard reality, three clarifications make the maintenance maturity model more useful.
First, reactive work never goes away. Run-to-failure can be the right call wherever the cost of prevention exceeds the cost of failure. The difference between stage 1 and stage 5 in the model is whether reactive is a strategy you chose per asset class or the default that chose you.
Second, maturity is set per asset class and per failure mode, not per site. End-of-line packaging machines with vibration monitoring can sit at stage 4 while the valves two buildings over are firmly at stage 2, and both can be the right answer. Averaging across a plant hides the decisions that matter.
Third, you cannot skip stages. Predictive models learn from failure history, and failure history is built by the planned and preventive work you do today. An organization that jumps from firefighting to a predictive program has bought stage 4 technology without the stage 2 and 3 record it needs to learn from.
What is the P-F interval?
Prediction has a mechanical requirement that reliability engineers describe with the P-F curve, a concept that also traces back to the Reliability-Centered Maintenance (RCM) literature.
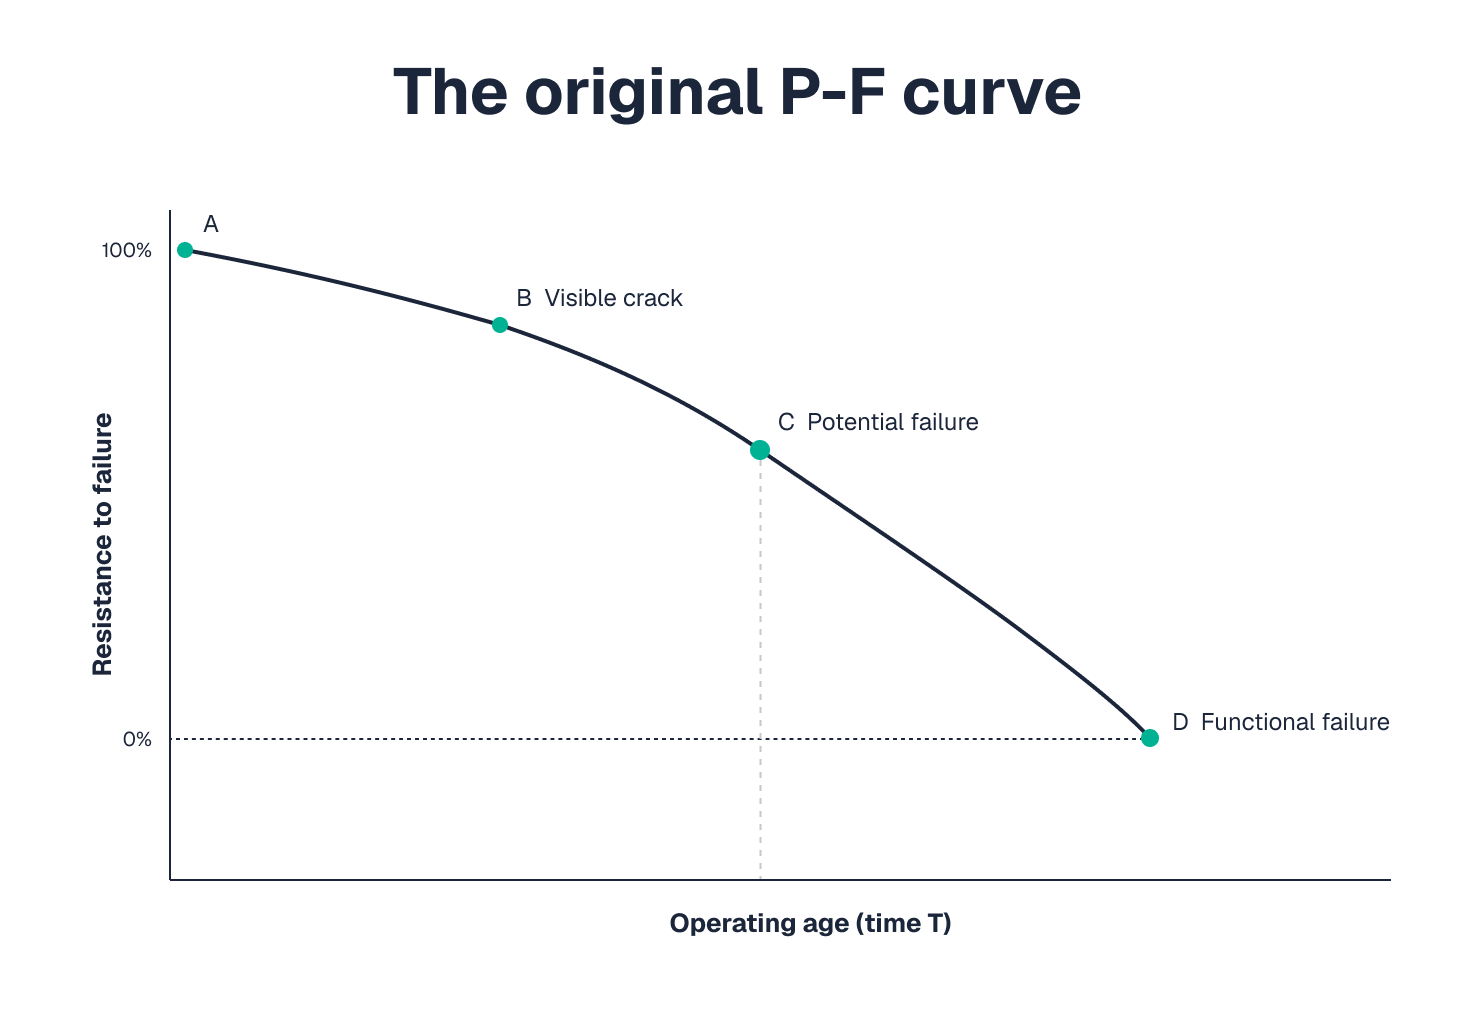
A developing failure becomes detectable at some point P, and the asset functionally fails at a later point F. Everything predictive happens in the interval between them.
Catch the signal early in that window and you plan the repair on your terms. Miss it and you are firefighting.
What data streams are needed for predictive maintenance?
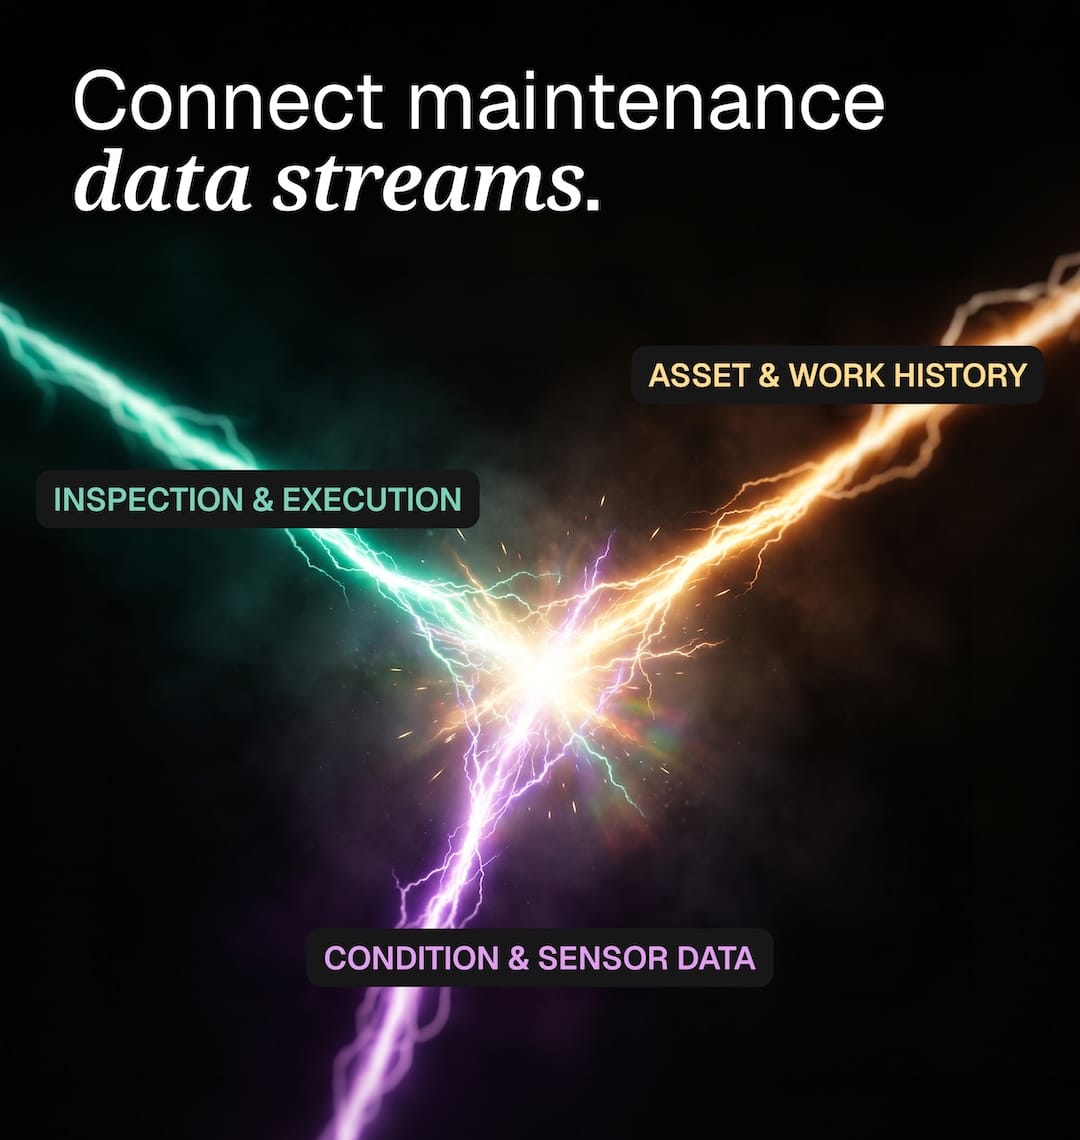
Catching the signal requires three data streams, connected:
- Asset registry and work history. Equipment master, functional locations, bills of materials, failure codes, notifications, work orders, PM plans, and parts usage. For most asset-heavy enterprises this sits in SAP.
- Operating context and condition signals. SCADA and PLC data, historians, and sensor readings such as vibration, temperature, pressure, runtime, cycles, and load.
- Inspection and execution reality. Readings, checklists, measurements, photos, notes, defect observations, and compliance evidence. The as-found and as-left record.
We went deep on these streams in why the future of SAP maintenance starts at the frontline.
The short version: the first stream is structured by design, the second arrives automatically from sensors, and the third depends on a human capturing it in the moment.
That makes the third stream the weak link, and it is the one most maturity roadmaps budget the least for. An inspection reading that lives in a paper binder cannot be trended, which means the P-F interval closes unobserved.
What each transition actually requires.
The practical question is never how to reach stage 5 or how to get reactive work to zero. It is how to make the next transition for the asset classes where it pays.
- From firefighting to planned: get every job into a work order, build a visible backlog, and protect planned work from daily interruptions. Make sure whatever digital solution you use for work orders and notifications has high adoption – this is the foundation for everything else.
- From planned to preventive: make failure codes usable and used, rank assets by criticality, and challenge PM intervals against failure history. Capture inspection results digitally instead of on paper, for example with digital forms that write back to SAP.
- From preventive to predictive: connect condition signals to work history on your most critical assets first, and bring operators into detection with operator-driven reliability.
- From predictive to intelligent: close the loop. Feed outcomes back into the models, and let the system propose plans that planners approve. This stage depends on everything below it being trustworthy.
What to do next.
Place each major asset class on the curve, honestly, and decide your reactive share on purpose. Then look at the third data stream. If technicians report work on paper, hours later, or under protest, that is your constraint, and it caps every stage above you.
Fixing it is faster than most maturity programs assume. Arkyn deployments go live in 2 to 6 weeks, with technicians able to report complete work histories from their phones from day one.
Get in touch and we will show you what that looks like against your SAP system.